-40%
Dynamic trend Indicator with scans for ThinkorSwim,
$ 23.76
- Description
- Size Guide
Description
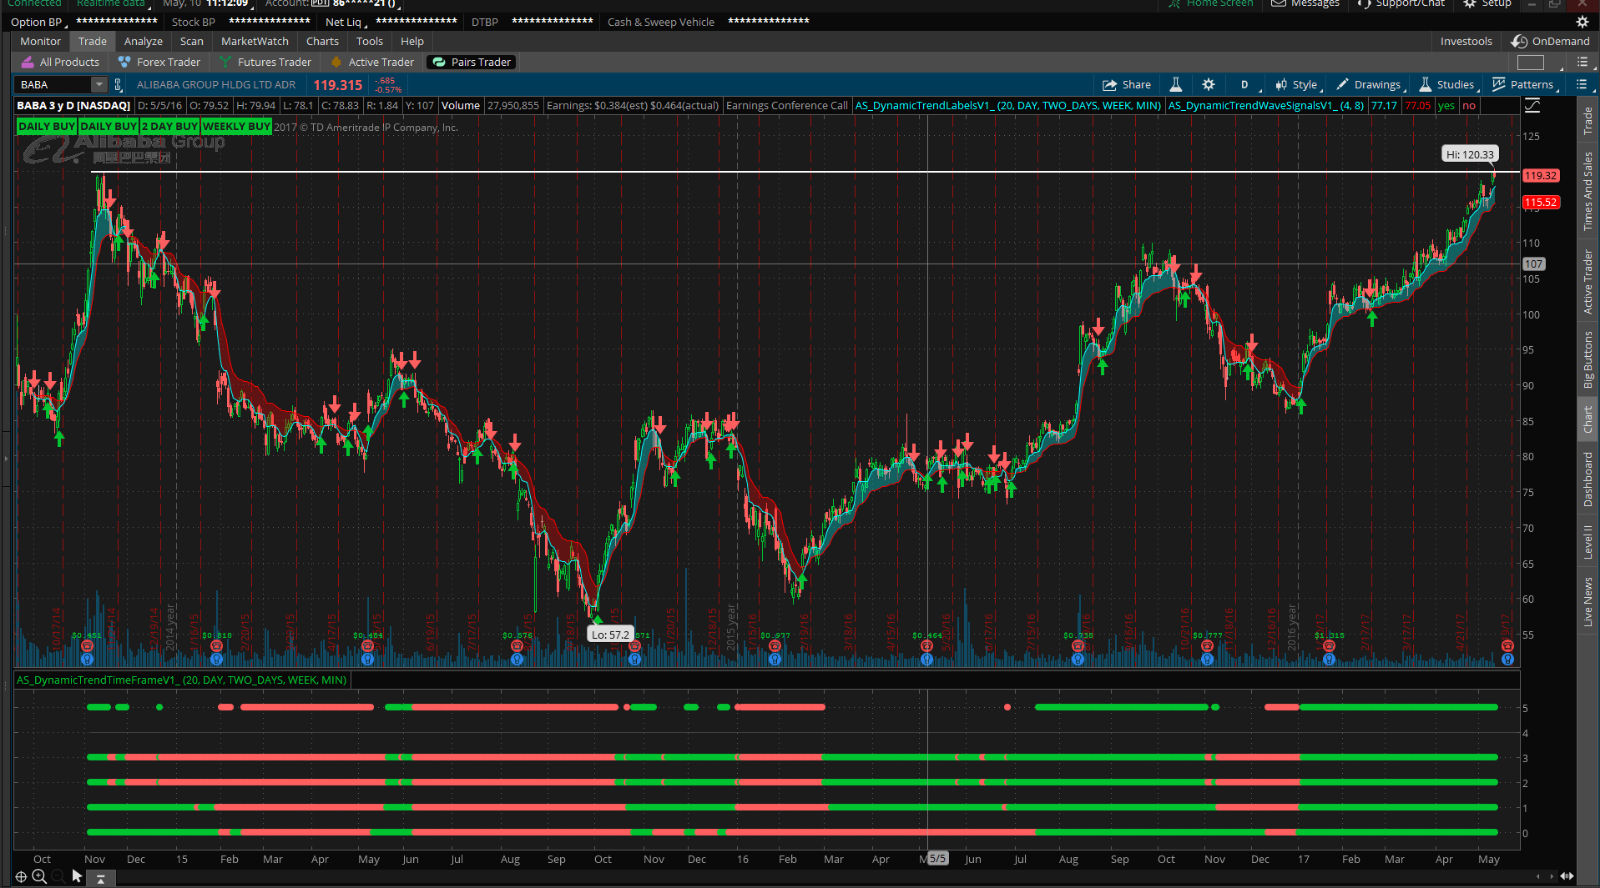
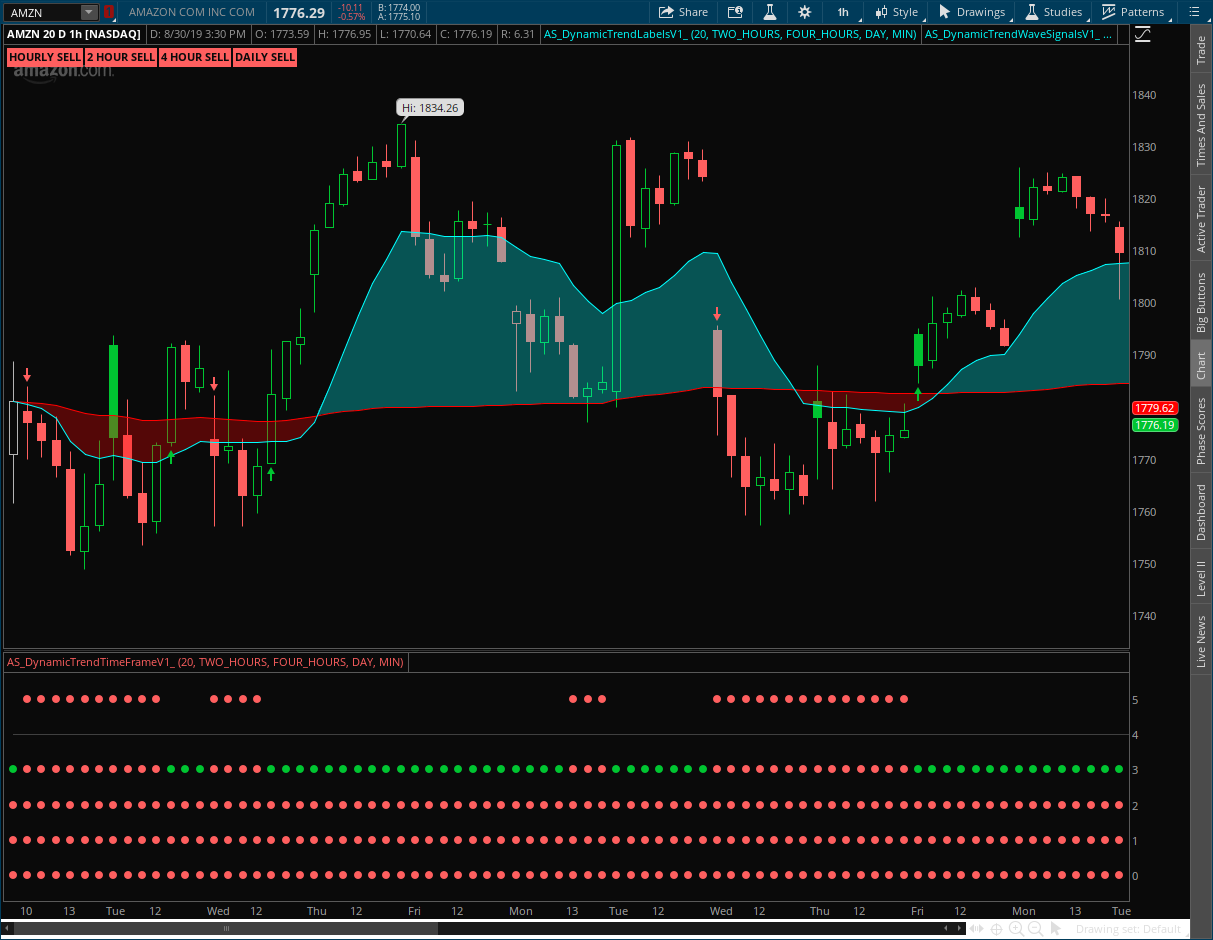
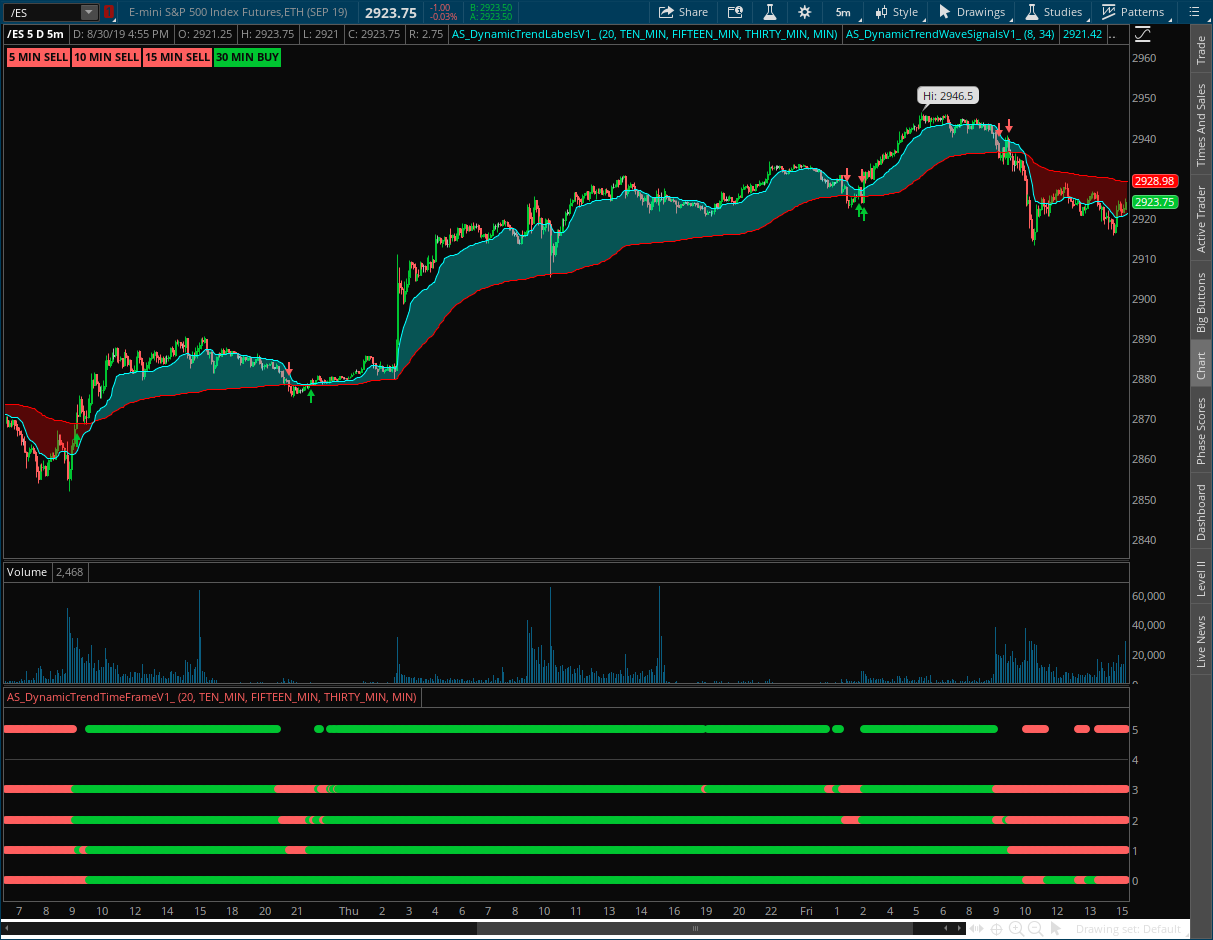
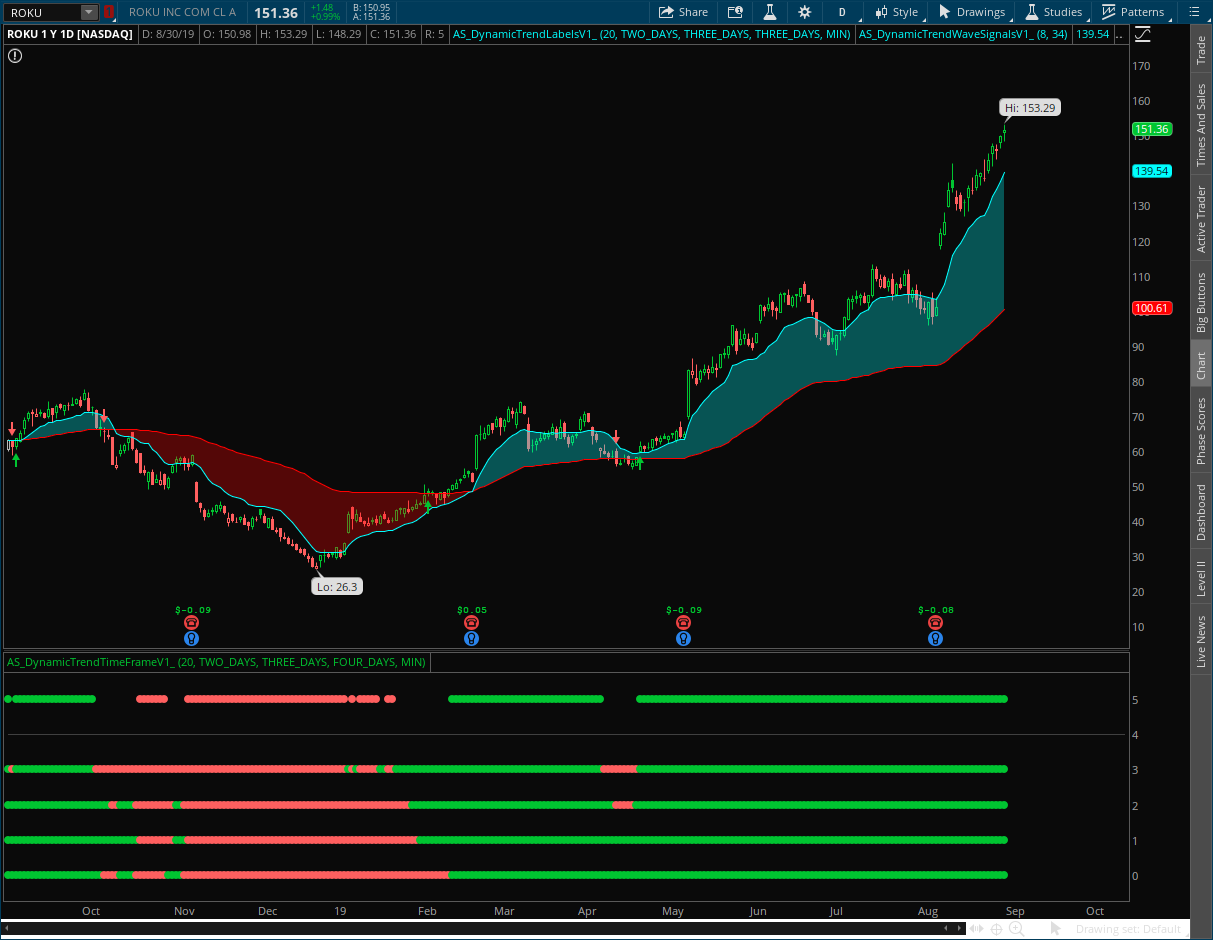
Unlike most indicators which captures price movements "after" the move this indicator speeds up with volatility as price rapidly moves. This produces a dynamic trend wave used to determine entries, exits, and market direction for swing and day traders. Combined with multi-time frame analysis this combo creates the complete trader toolkit when analyzing stocks, options, and futures.To summarize:
Is price above or below the wave?
Is the arrow product signaling buy or sell?
Are all the time frames signalling a buy or sell?
If all 3 confirmations are correct, initiate the trade!
The wave is a combination of moving averages combined with a volatility study. As the wave trends up the price action turns bullish. As the wave trends down price action turns bearish.
A flat wave = chop. The wave expanding and contracting is the measurement of volatility. This is measured in real time and adapts in real time unlike Bollinger bands.
Includes setup and guide videos, and scans for longs and short trade ideas
Indicator will be emailed after payment is received. Please note there are no refunds offered, so please send any questions prior to bidding/purchasing.
Thank you for your interest


