-40%
PACK of 30+ CUSTOM ThinkorSwim Indicators, Scans, and Strategies!
$ 208.39
- Description
- Size Guide
Description
Upon purchase you will receive:A nearly identical document to the one shown below (minus redactions)
Future updates/improvements to the tools listed below
Access to future Indicators, Scans, Strategies, etc. as they become available
Contact information incase you have trouble setting up and/or using any of the tools listed below
A friend :)
Follow me on twitter (GrabThatTick) for screenshots of various charts demonstrating how some of the indicators have performed during the week.
================================================================================================================
Vinny’s
ThinkorSwim
Toolbox
Like most traders, I have always been trying different strategies to use to my advantage while trading. Sometimes a new strategy requires you to take in more information, while other times, it’s all about getting a different perspective of the markets.
Over years of trying different things I have collected quite a few different Indicators, Scanners, Chart Styles, Strategies, etc. These are tools that I use to help me make better decisions in various types of markets. However, many of the tools I wanted are very hard to find, so I created them myself. I am not a professional coder but I have and will continue to put in countless hours creating, adjusting, and fine tuning things to get these tools to work as best as possible. Not all of these tools are perfect for everyone and in every situation, but I am confident that most individuals will find at least something here that they see as beneficial.
Why am I trying to sell my indicators if I can just use them to make money?
Well, as a trader/investor my job is to identify market inefficiencies and use an edge that I have to capitalize on those inefficiencies. When I was told about the ThinkorSwim indicators that are being sold on Ebay I looked into them and realized that most of them are overpriced garbage and I believe that I can offer something much better to the market of ThinkorSwim indicators on Ebay.
Why should you trust me?
Good question. I am just a random person you stumbled across while browsing Ebay listings. I totally understand the skepticism. However, just like when you are analyzing a possible trade; you have to look at it from all angles and weigh the risk/reward.
(The risk that I am dishonest and these tools are fake or poorly coded VS. the possibility that you will find these tools useful and your trading is enhanced as a result)
I am not claiming to be a “trading guru”. I am not trying to sell you a trading course. I am not claiming that I can give you perfect buy/sell signals. All I am doing is offering tools that I use myself, for a relatively small fee for the time that I put into creating these. If you would like to discuss what I have to offer before purchasing, feel free to message me on the twitter account I set up for this ( GrabThatTick ) and I will try to respond to any of your concerns as quickly as possible.
Who would benefit from these tools?
Anybody who is interested in trading stocks, futures, options, bonds, etc. These indicators work well for those who are looking to scalp, swing trade, or even those who are more passive investors who just want a better way to find good entry zones.
Some of the trading strategies I use are a little more ‘advanced’ than just trendlines and price levels, but I have tried to implement my trading styles into these indicators in such a way that you don't have to be an expert to understand what the chart is telling you..
Upon purchase, I will offer a more ‘enhanced’ form of support to get you set up. Although I am a trader and not a teacher;
(those who cant do, teach)
I do love talking markets and very rarely turn down a discussion regarding how to trade with anybody regardless of their experience. I believe it is important to hear as many perspectives as possible and I have no issue talking about my strategies.
Hope this helps!
Vinny
Indicators
Some of these charts have multiple studies added to them to save space/time. You do not have to keep them together and can remove the studies you don’t want.
All source codes can be viewed/adjusted by opening up the “Edit Studies and Strategies” window and right clicking a particular study/strategy. From here you can make more advanced changes in calculations and learn more about how it all works to maybe even figure out how to do it yourself! (That’s how I learned)
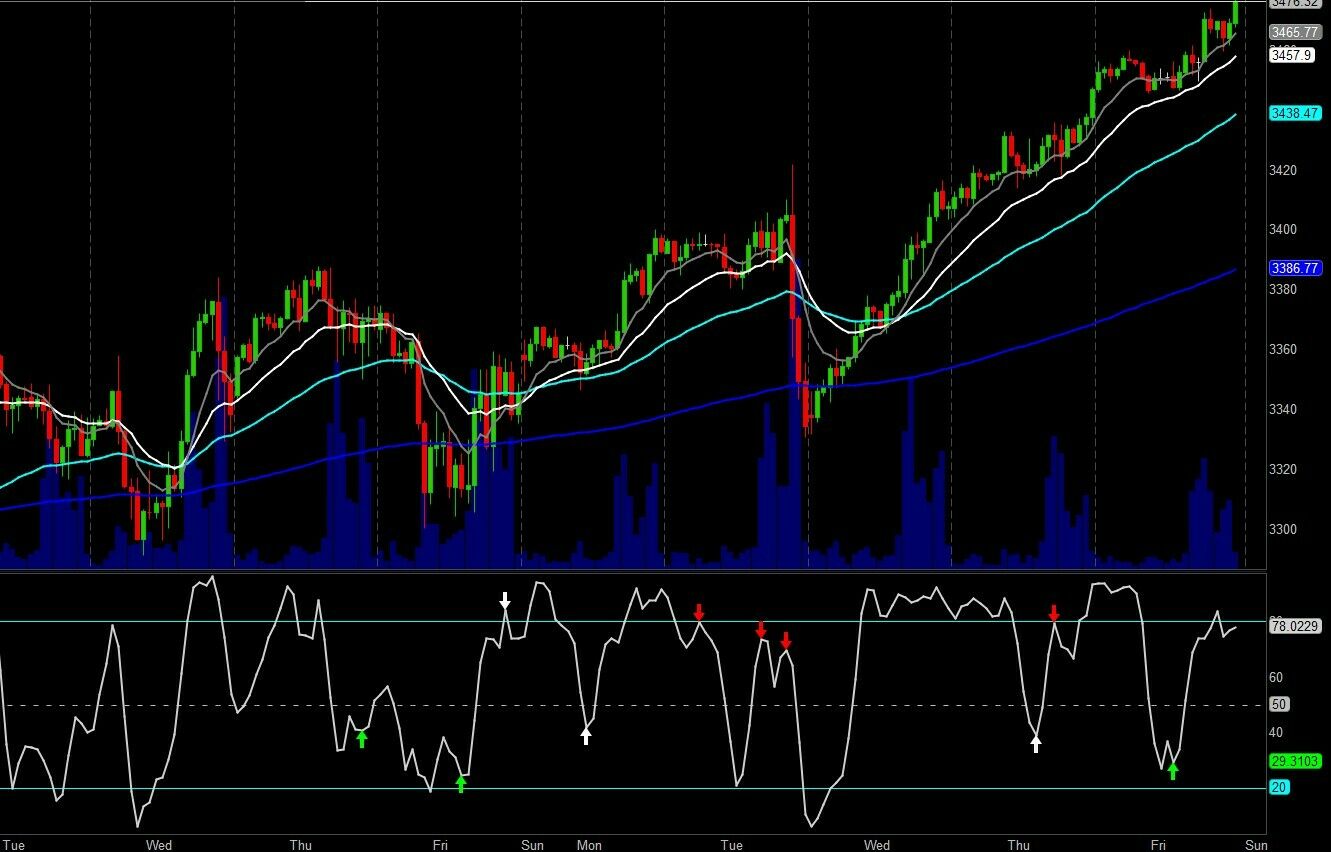
Stochastic Divergence Indicator
I was having a hard time finding a stochastic divergence indicator that worked well. So, I coded my own from scratch and even added in some little features I thought were cool and useful.
This study uses a StochasticFast that can be adjusted to any length you prefer through the properties menu. (Default is 9,3)
Green
Arrow = Buy Divergence
Red
Arrow = Sell Divergence
White Arrow = Hidden Divergence (both directions)
To enable/disable hidden divergences, select “Yes” or “No” in the properties.
Works on all tickers
Works on all timeframes
Audible Alerts Available
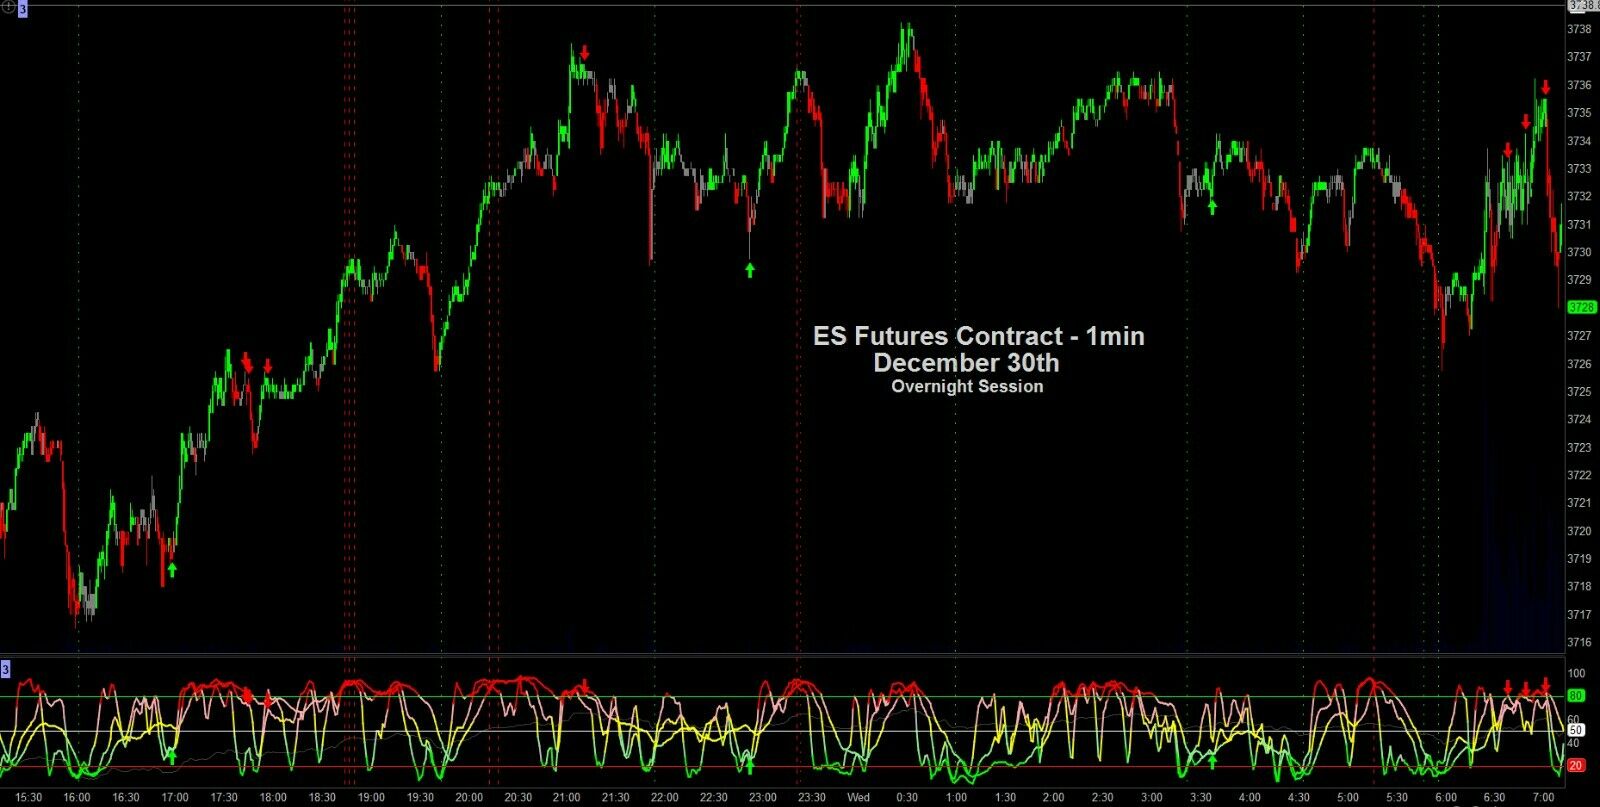
The Tick Grabber 5000 V6
-
UPDATED
Added “Gap Protection”
Added KillSwitch Thresholds That Self-Adjust Based on Trend Quality
Increased Level 1 & 2 Sensitivity
Slight Decrease to Level 4 Sensitivity
Sensitivity Levels now Slightly Impact KillSwitch Thresholds
Slightly Increased KillSwitch Sensitivity
Added “Average Stoch”
Slight RSI Adjustments
Volatility Threshold Adjustments
Added Text Notes Within Alerts
Other Misc. Adjustments
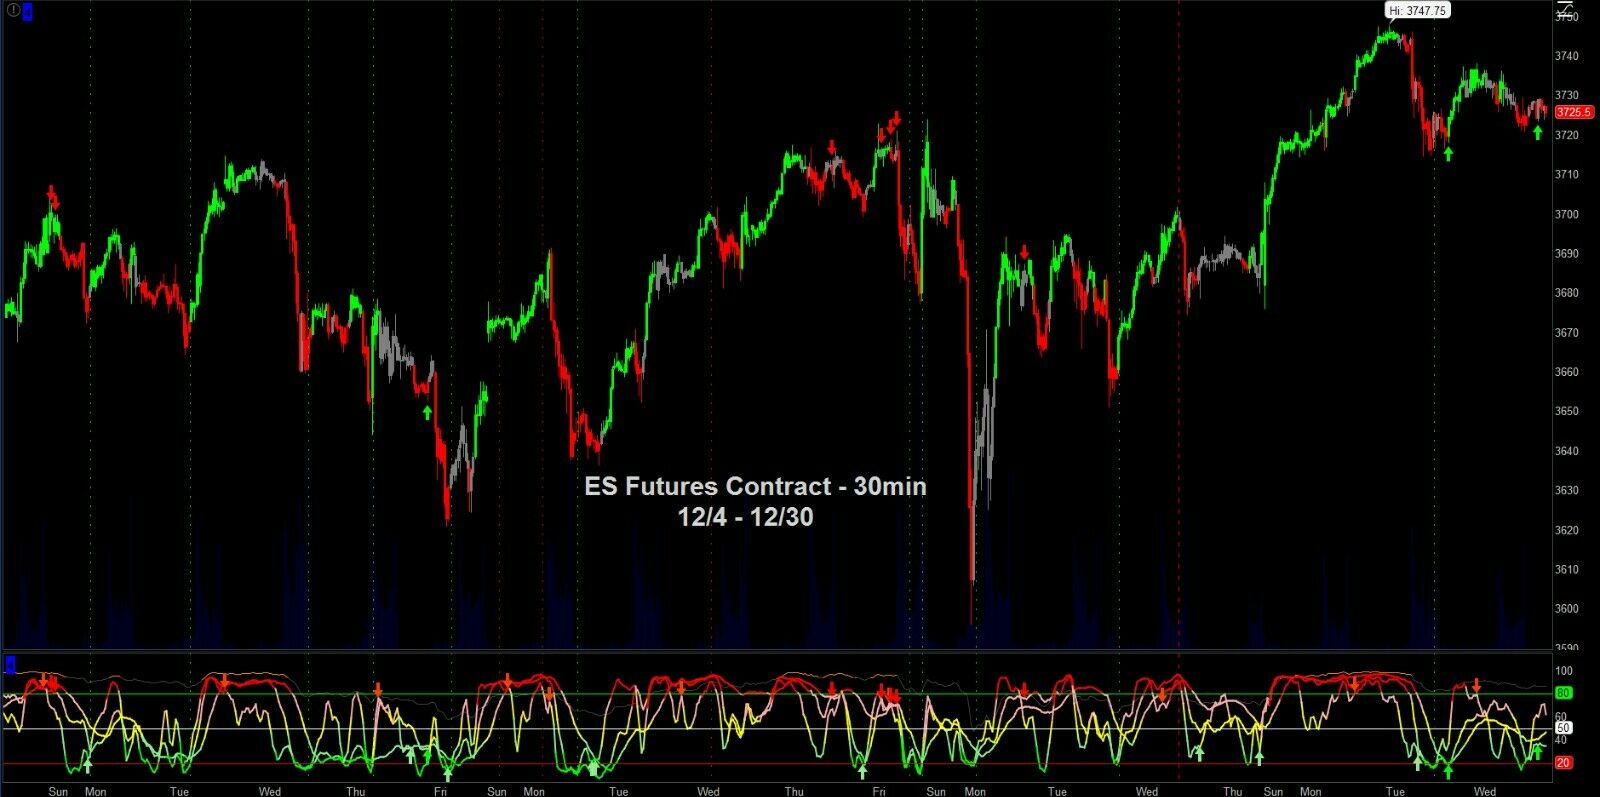
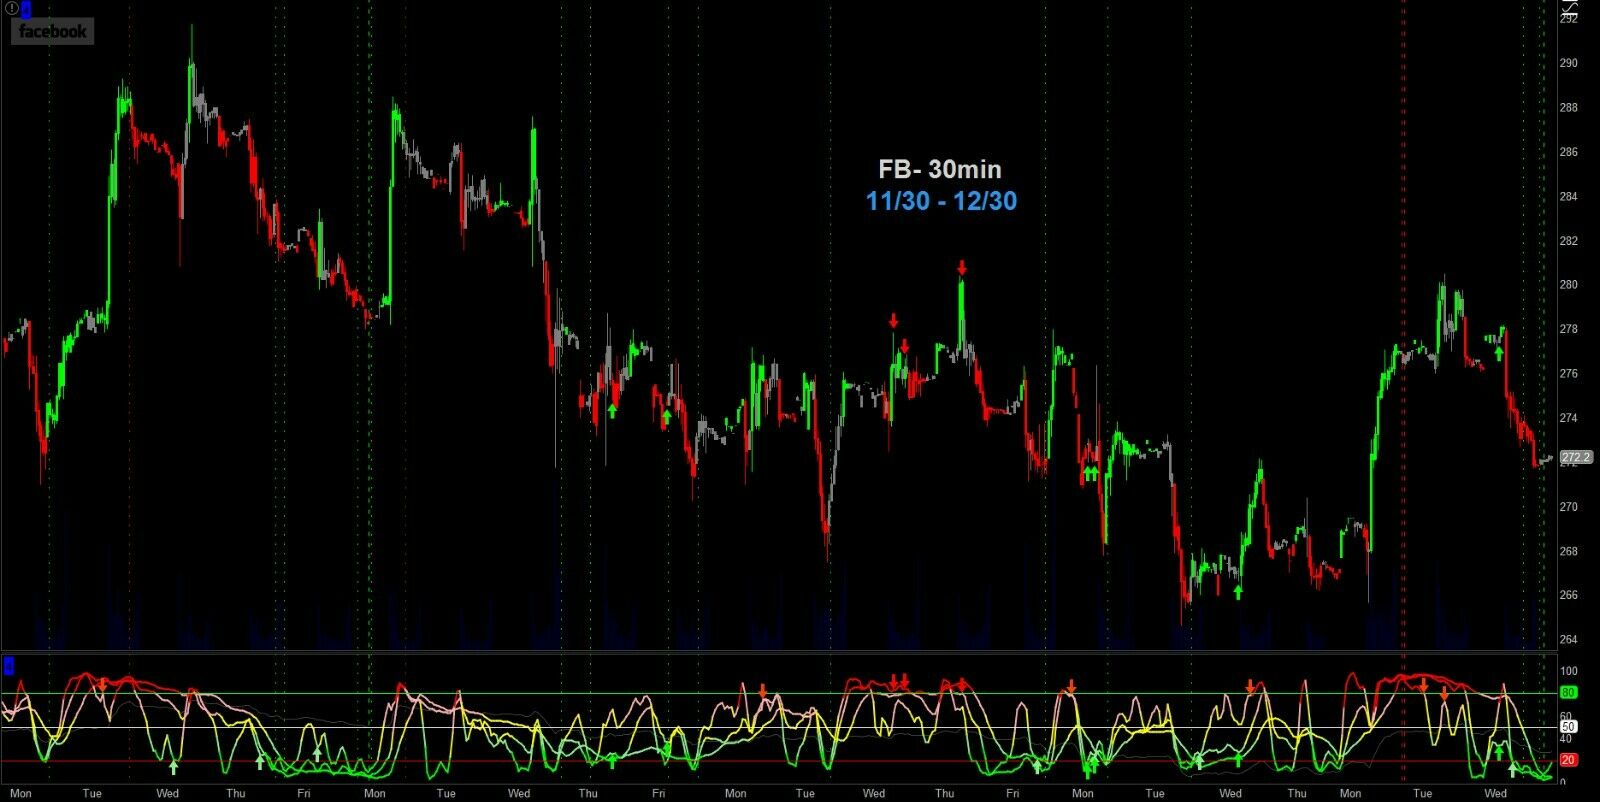
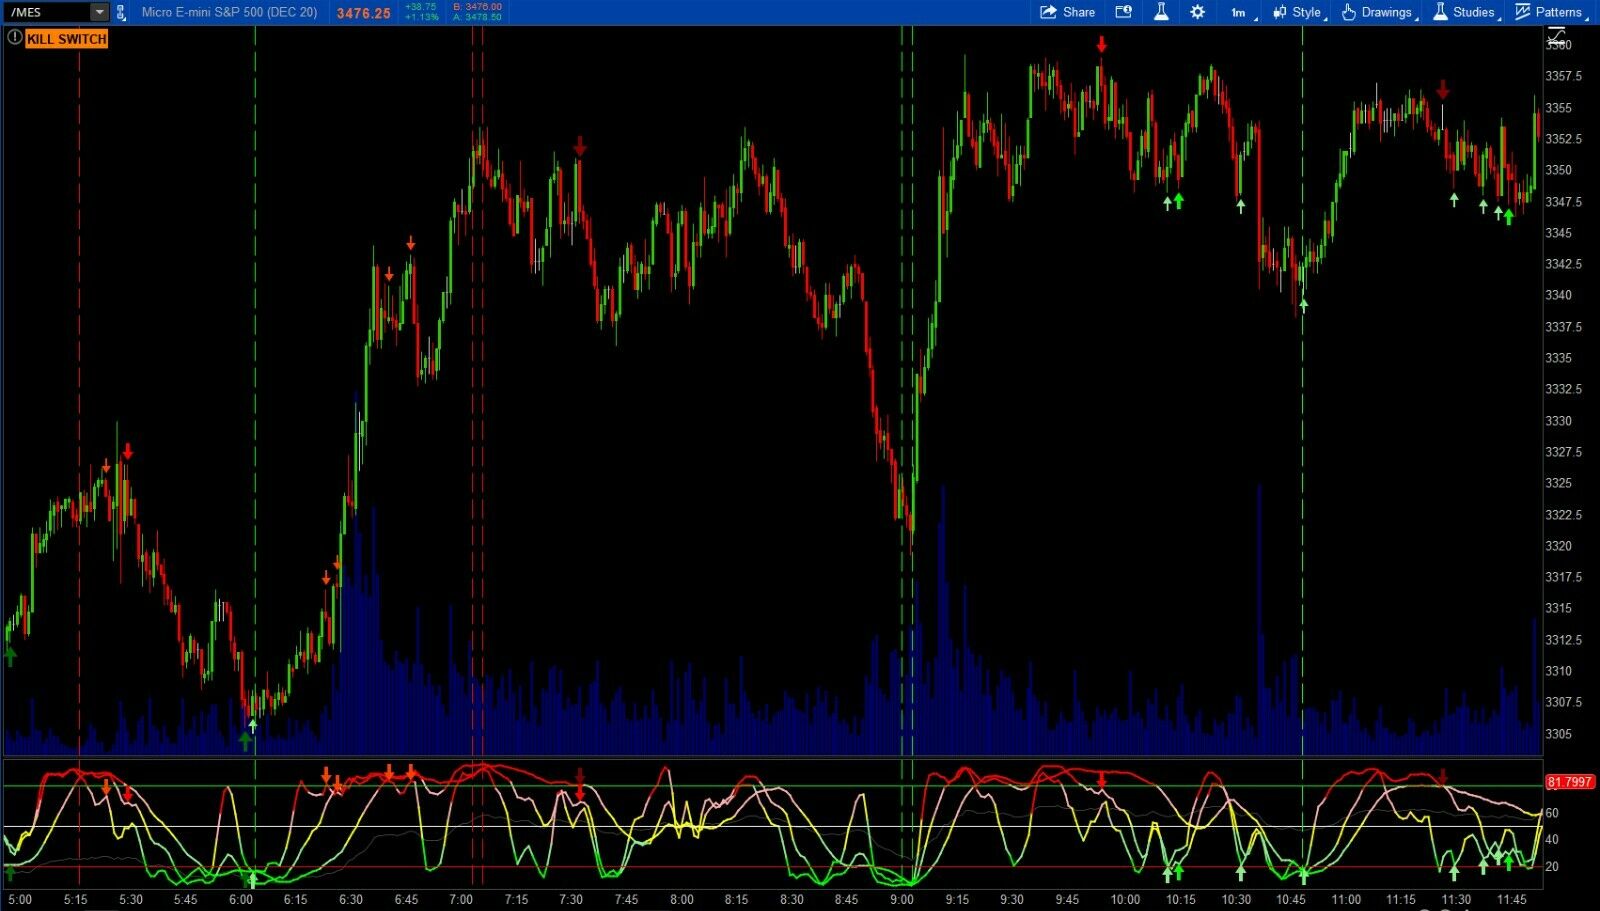
The TG5000 is an algorithm that analyzes the momentum of a stock’s price and then uses those calculations to identify areas where momentum appears to begin changing direction.
By utilizing
4 stochastic oscillators, 4 ATRs, 2 MACDs, 2 RSIs, CCI, Trend Quality,
and
Divergences;
it collects a broad range of data to give it multiple perspectives to consider before showing the user a signal that momentum appears to be shifting. These calculations will self-adjust to accommodate for any ticker’s price or volatility. Other than selecting one of the
4 Sensitivity Levels
available, there is no need for any complex optimizations or adjustments for the user to make.
There are
3
types of signals that are shown for both long and short entry zones:
·
Vertical lines
o
Green
or
Red
vertical lines that are composed of
short dashes
are signals focused mainly on the MACD and RSI.
o
Green
or
Red
vertical lines that are
solid
are signals focused mainly on stochastic oscillators.
·
Arrows
Since there are three separate stochastics all showing their own individual divergences I have color coded them accordingly. Each divergence signal can be individually turned on or off in the settings menu.
o
Light Green
and
Light Red
arrows indicate buy/sell divergences on the shortest-length stochastic.
o
Green
and
Red
arrows indicate buy/sell divergences on the mid-length stochastic.
o
Dark Green
and
Dark Red
arrows indicate Buy/Sell divergences on the longest-length stochastic.
o
White arrows indicate hidden divergences on all stochastics (both directions).
·
Candle Colors
Candles are colored based upon multiple calculations used to identify the current trend’s status.
Best practice is to use the candle colors to confirm signals that are shown!
o
Green
candles signify bullish price movement.
o
Red
candles signify bearish price movement.
o
Gray
candles signify price movement that is not defined well enough to be considered bullish or bearish.
The TG5000 offers the user
4
Sensitivity Levels
:
Each level comes with different conditions/thresholds that need to be met before a signal can be shown. The higher the level, the less restrictive the required conditions/thresholds are. The current level being used for the chart and the Stochastic will be shown in the upper left corner of the chart or stochastic. They do not need to be the same level and you are able to remove either study without impacting the other.
·
Level 1
o
At least 2 different MACD signals must be triggered and the color of the candles must match the direction of the signal, within 4 bars.
OR
o
A stochastic oscillator signal must be triggered and the color of the candles must match the direction of the signal, within 4 bars.
Color Matching example:
If a buy signal is triggered, it will not be shown unless a
green
candle follows it, within 4 bars.
If a sell signal is triggered, it will not be shown unless a
red
candle follows it, within 4 bars.
·
Level 2
o
Will show signals for all MACD and Stochastic signals, but still requires color matching within 4 candles.
o
Thresholds for other variable conditions such as RSI and ATR are similar to level 3.
·
Level 3
o
This level does not require color matching for signals to be shown.
o
Thresholds for variable conditions such as RSI and ATR are further reduced.
·
Level 4
o
This is the most aggressive level available.
o
Many variable thresholds are further reduced in effort to give the user a greater amount of trade opportunities.
The TG5000 Offers “Gap Protection”
Due to the nature of how the stochastic oscillators and MACD reversals the TG5000 makes its calculations with, when a chart has many gaps it can cause the script to produce false signals. In effort to combat this; I have a “Gap Protection” setting that will prevent signals if there has been a gap of the lesser of 0.25% or 10 ticks within 4 candles on time frames of
less
than 4 hours. This new feature should significantly improve the TG5000s performance on stocks but can be turned on or off within the settings.
The TG5000 uses a self-adjusting “Kill Switch”
In effort to combat a market that is moving in one direction for a prolonged period of time with little to no corrections, The TG5000 will enable a “Kill Switch” that will prevent it from showing any signals that are likely to be run over by a very strong and steady market. However, The TG5000 will continue to show signals that align with the overall trend of the market.
This is accomplished by using a stochastic oscillator that will adjust itself depending on the timeframe of the chart it is on. The status of the Kill Switch can be seen by looking for the
gray
stochastic line to turn
orange
or
by looking for the “KILL SWITCH” label to be shown in the upper left corner of the chart.
Self-Adjusting Kill Switch Thresholds
In effort to further prevent the TG5000 from showing signals that may get run-over by a strong trend, it will now adjust the thresholds of the Kill Switch based upon the strength of the current trend.
It accomplishes this by first determining the algebraic sign of the difference between two different exponential moving averages. Then, it will combine that number with a cumulative price change calculation that is reset back to zero after each identified trend reversal. The absolute value of the calculation is what is used to expand/contract the Kill Switch thresholds.
Users will be able to view this by looking at the white lines on the Stochastic Oscillator study. When a strong trend is occurring, the white lines will begin to contract, which will cause the Kill Switch to be more likely reached, until the trend reverses. These lines can be turned on or off within the settings.
“Average Stoch”
Keeping a chart as clean as possible is always important since the less information you have to analyze, the quicker you will be able to make a decision. Therefore, I have included the option to remove the 3 stochastics and use an average of them instead. You do not necessarily need to use all three stochastics since the script is doing that for you, but it is nice to be able to get a general idea of what they are doing. ALL calculations/signals are the exact same while using either option. To change this simply uncheck the “Show Plot” box for LTF, MTF, STF and check the Show Plot box for the “Average_Stoch” instead.
The TG5000 offers several settings available to the user
·
Sensitivity Level
– Use this to select the sensitivity level used for signals to be shown.
·
Disable Killswitch
–
Use this to disable the Killswitch feature (not recommended)
·
Gap Protection
– This is used to enable or disable the Gap Protection feature (not recommended).
·
Show Vertical Lines
– This is used to turn on or off the vertical line signals.
·
Show Killswitch Thresholds
– This is used to make Killswitch thresholds (white lines) viewable or hidden.
·
Show Arrows
– This is used to select to show or hide all of the arrows signifying divergences.
·
Line Alerts On
– Use this to turn the
audible alerts
for the vertical line signals on or off.
·
Divergence Alerts On
– Use this to turn the
audible alerts
for the divergence signals on or off.
·
Long Only Signals
– This option allows you to have the TG5000 only show you buy signals.
·
Show Hidden Divergences
– Use this option to include hidden divergences to be shown in addition to normal divergences.
·
Div Long
– This setting will allow you to decide whether or not you want to see divergences for the longest-length stochastic oscillator
·
Div Mid
– This setting will allow you to decide whether or not you want to see divergences for the mid-length stochastic oscillator.
·
Div Short
- This setting will allow you to decide whether or not you want to see divergences for the shortest-length stochastic oscillator
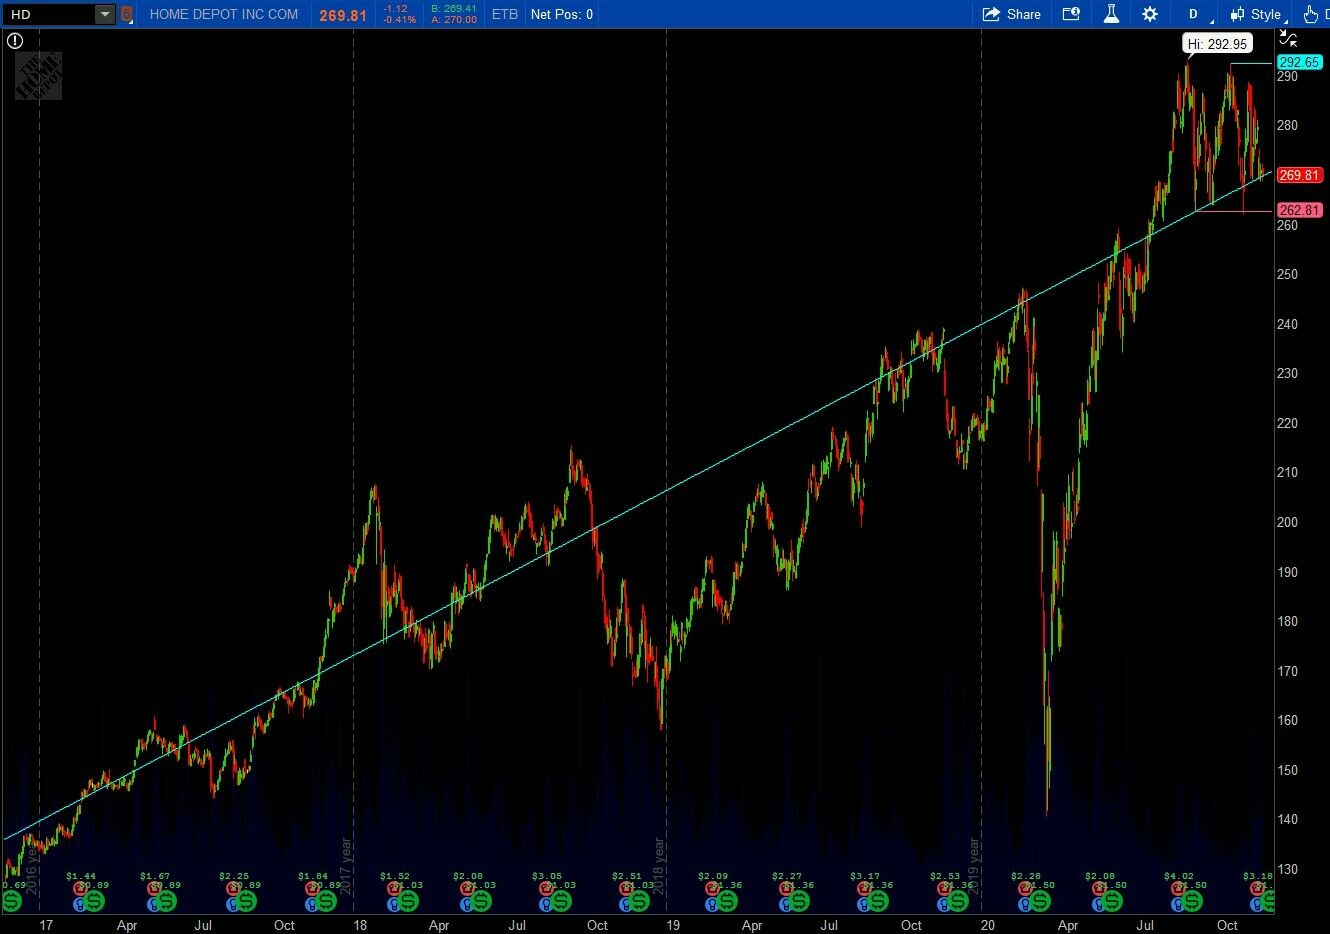
Automatic Trendlines
Draws Trendlines. Use multiple instances of this study with varying length values.
Works on all tickers
Works on all timeframes
Fundamental Data Labels
Shows you various fundamental data labels
Works on all timeframes
Works on most tickers
Average Price Since Earnings
Plots the average price per share since the most recent earnings announcement.
Works on all timeframes
Works on most tickers
Multiple Moving Averages w/Crossover Alerts
An easier way to pull up multiple moving averages without having to have tons of different studies to sort through.
Simply pick which moving average lengths you want in the properties menu.
You can also quickly and easily change which type of moving averages you want to be used (exponential, simple, weighted, wilders, hull) by using the dropdown menu within the properties menu.
Audible Alerts & Visual alerts for crossovers of lengths 2, 3, and 4 available
You may choose to show
visual
alerts of crossovers of lengths 2, 3, and 4 with vertical lines OR arrows (OR both!)
Works on all tickers
Works on all timeframes
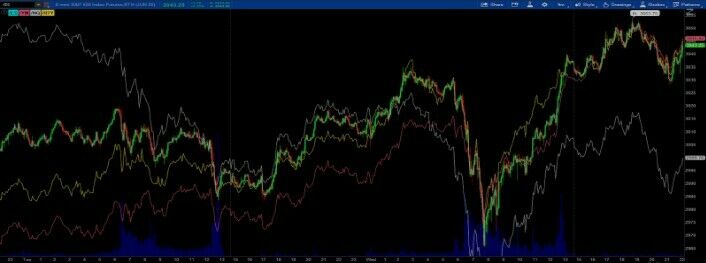
Multiple Comparison
Similar to the “Comparison” study already available on ToS, but allows up to 4 different symbols to be shown on the same chart. I created this so I can take a quick glance and get an idea on what various indices are doing in comparison to each other but you can use it to compare any tickers you prefer.
Works on all tickers
Works on all timeframes
Consecutive Candle Counter
I made this study so it is easier to quickly scroll through charts and get a glance at how many Green or Red days have occurred consecutively. Plots the counter in the upper left corner of the chart.
Works on all tickers
Works on all timeframes
Simple Price Line
Just a simple horizontal line that follows the current price. Makes looking for current support/resistance levels a little more efficient.
Works on all tickers
Works on
intraday
charts only
Intraday High/Low
Continuously tracks and plots intraday lows and highs. Simple, but nice to have.
Works on all tickers
Works on all timeframes
Average Entry Price Plot
Automatically calculates and plots your cost average beginning from the last time your cost average changed.
Works on all tickers (that you have open positions in)
Works on all timeframes
Audible Alerts Available
High/Low Priceline / Hammer Candle Color
This chart includes 2 studies:
High Low Priceline
= Dynamic priceline indication bars with higher highs and higher lows in green,lower lows and lower highs in red, and other bars in gray.
Hammer Candle Color
= Changes the color of hammer candles depending on the settings that you set it to in the properties menu.
Works on all tickers
Works on all timeframes
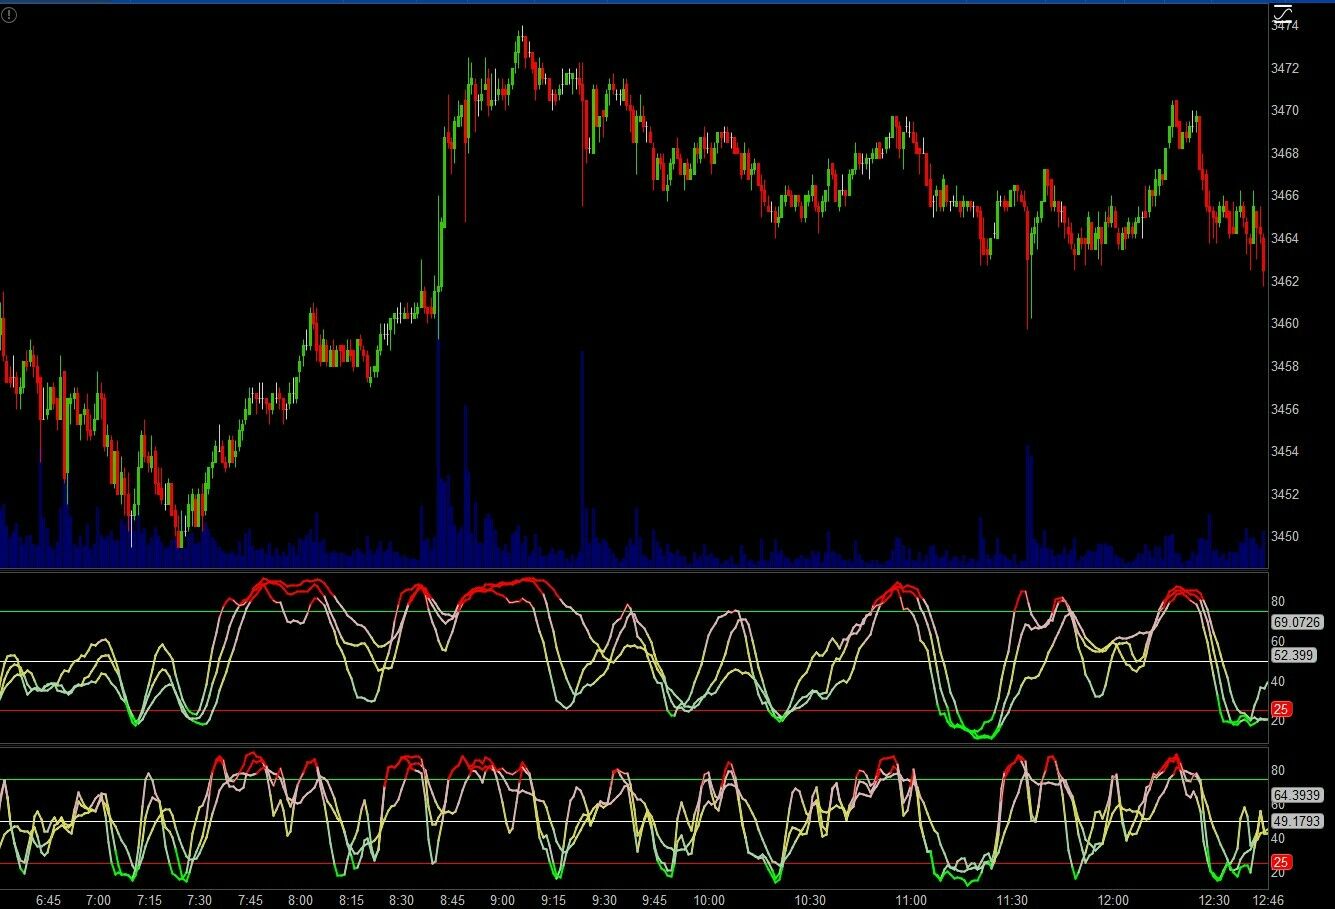
Triple Stochastic Indicators
Two similar Triple Stochastic indicators showing overbought and oversold conditions with one being a little more ‘sensitive’/quicker than the other to provide you with an overview of smaller trends within larger rotations and assist in obtaining better entry/exit areas. .
Works on all tickers
Works on all timeframes
Audible Alerts Available
Gap Ribbon
Displays the number of gaps up or down over the past x amount of bars and keeps a running total in the ribbon.
The threshold for what is to be considered a gap up or down can be adjusted in the properties.
Works on all tickers
Works on all timeframes
SCANS
- Dual Buy Divergence Scan (Daily)
Dual Divergences are comprised of 9,3 & 14,3 stochastics
- Dual Sell Divergence Scan (Daily)
- Aggressive Dual Buy Divergence Scan (Daily)
Includes hidden divergences
- (9,3) Buy Divergence Scan (Daily)
- (9,3) Sell Divergence Scan (Daily)
- (14,3) Buy Divergence Scan (Daily)
- (14,3) Sell Divergence Scan (Daily)
- 1minute + 5minute Divergence Scan (9,3)
- Triple Stochastic Oversold (Daily)
- Triple Stochastic Overbought (Daily)
-
Triple Stochastic Oversold (30Min)
- Triple Stochastic Overbought (30min)
- Multiple Bullish Events Scan
Gap ups
Closed on the high of the day
Closed up on 2 times the average volume
Today’s high is a 1 year high
DarvasBox Box buy signal
Tick Grabber 5000 Scans
These scans only include vertical line signals, divergences are not searched for.
You can easily change the timeframes being searched
as well.
- TG5000
15 Minute
Buy Scan
- TG5000
1 Hour
Buy Scan
- TG5000
4 Hour
Buy Scan
- TG5000
Daily
Buy Scan
- TG5000
15 Minute
Sell Scan
- TG5000
1 Hour
Sell Scan
- TG5000
4 Hour
Sell Scan
- TG5000
Daily
Sell Scan
STRATEGIES
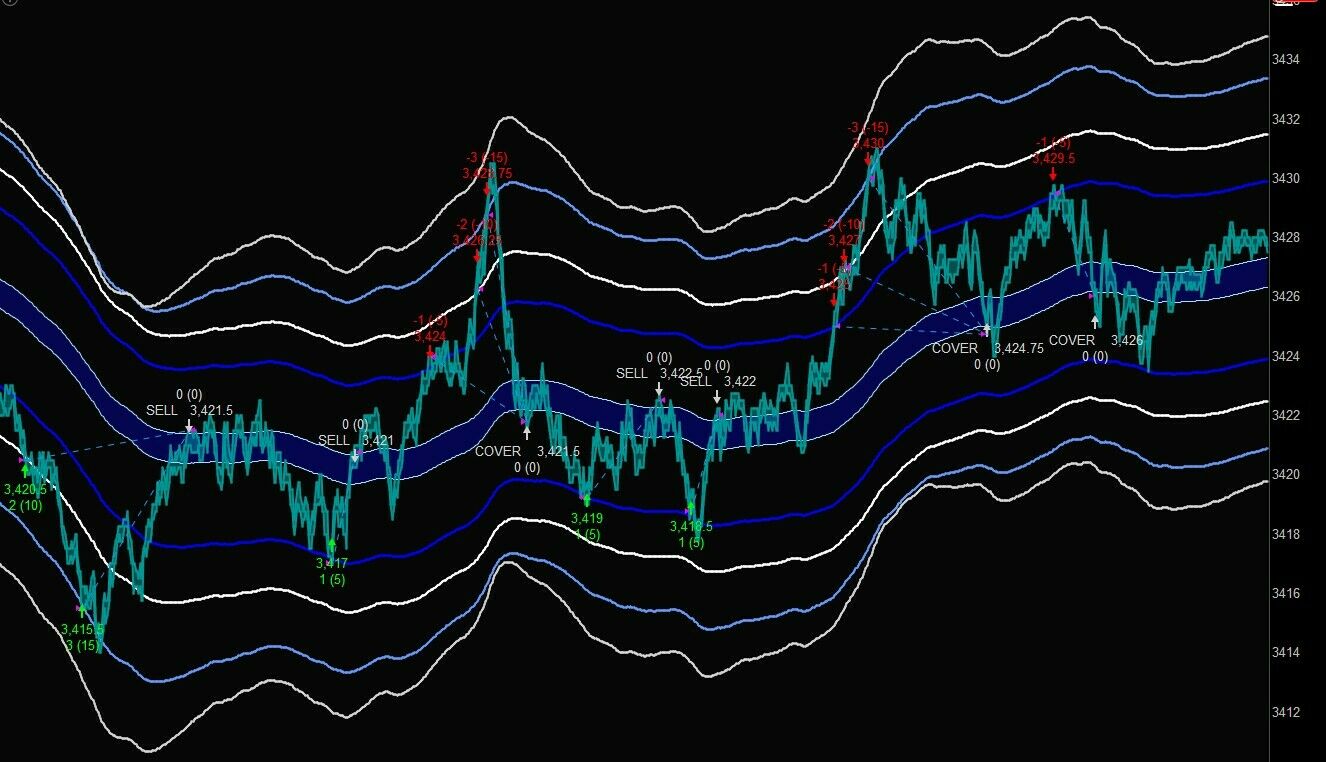
THE VIN-TRON 5000
What is it?
THE VIN-TRON 5000 is my first attempt at coding a trading strategy entirely from scratch. It is a simple mean reversion strategy for trading the /MES contracts using a
REDACTED
chart and the
REDACTED
Why?
The initial goal of building this was to try to improve upon my entry orders when trading the
REDACTED
chart after being turned on to this type of counter-trend scalping by the one and only
REDACTED
. I was looking to figure out what was
statistically
the ideal distance from the
REDACTED
to begin opening positions and adding to positions. (Playing with this is also a great way to spend time between trades rather than watching Youtube videos)
What does it do?
It uses the
REDACTED
with multiple offsets above and below the actual
REDACTED
to counter trend the /MES contracts.
-
Each pair of
REDACTED
(1 above, 1 below) is connected to an order to either open, close, or add to a position.
-
The outer
REDACTED
open/add to positions while the innermost pair are used solely for closing positions.
How do I use it?
By adjusting the order placement (offset), position sizes, and other variables to backtest and try to find the best set of parameters to implement into your actual trading by comparing your results using the “Show Report” stats in addition to the Floating P/L results located at the bottom of the chart.
You can make adjustments by right clicking on an
REDACTED
and going into the properties for that pair of
REDACTED
You can also enable/disable orders, by default there should be 4 long and 4 short orders with the 2 closing orders ½ point away from the actual
REDACTED
.
If you go into the “Edit Studies and strategies” menu you will see the list of available orders, each representing a pair of
REDACTED
(1 upper and 1 lower). From this menu you can also have it scale in much more aggressively by changing settings in the “Global Strategies Settings” menu (bottom left).
You can enable /disable the orders and
REDACTED
by checking the respective “Show Study” and “Enabled” boxes.
Now What?
Play with it and see what you can make it do. If you think you’ve set it up in a manner that is consistently profitable, you could - in theory - follow it with a live account by using the price bubbles to the right of the chart to see where it has buy/short/sell/cover orders placed.
This strategy works great in volatile and choppy market conditions; after collecting a couple weeks worth of data it has been able to maintain win rates ranging from 77% to 85%. However, its performance all relies on how well you can set it up.
Strong trending markets is where it gets killed, it has a stop loss order available to play with, but i’ve had a hard time getting it to cooperate and began focusing on other things. Eventually I may get the stop loss feature to work better.
Only recommended for /MES
REDACTED
charts
Audible Alerts are available
It will not enter positions 30 minutes before/after the futures open/close
It can be resource intensive, give it a minute to load when first opening it. If you find it to be causing lag, reduce how long it looks back to 1 day (
REDACTED
= 5 day maximum on ToS)
Have fun with it
THE VIN-TRON 55
55
It uses
REDACTED
to create bands that orders are attached to. However each band uses different
REDACTED
lengths. The idea behind this is to minimize drawdown by requiring more aggressive moves to trigger orders that will add to your current position without minimizing your opportunities to make trades.
It can still get run over from a strong and steady trend, but will do so with less contracts since it is better to take heat on 1 contract than it is to take heat on 4 contracts.
Offsets (how far apart the bands are from the actual
REDACTED
) and lengths are adjustable in the properties for each order.
Works best using
REDACTED
charts on the MES futures contract. The higher the tick count, the more aggressive it will trade.
The line at the bottom of the chart is the running P/L.
It will not enter positions 30 minutes before or after the futures open/close.
Audible alerts are available for the initial entry order.
There is an order to add to your position if you find yourself taking on heat in effort to cost-average (by default it is set at 80 ticks but that value has not been thoroughly backtested)
Stop loss orders are available to play with, but not advised. (ThinkorSwim makes backtesting them in this type of strategy difficult)
Feel free to play with the settings and see if you can get it to perform even better!
It can be used on other tickers, it will just require some tweaking of the settings (tick count, offsets,
REDACTED
etc.) to optimize it for those other tickers. Please share your parameters if you decide to play around with it and it performs well!
Have Fun!!
P.S. The price of this listing will increase by after each sale is made.
ALL SALES ARE FINAL
Disclaimer:
Past performance is not necessarily indicative of future results. All investments
carry significant risk and all investment decisions of an individual remain the specific responsibility of
that individual. There is no guarantee that systems, indicators, or signals will result in profits or that they will not
result in a full loss or losses. All investors are advised to fully understand all risks associated with any kind of investing
they choose to do.
